Financial position
- Free cash flow of EUR 170 million below the prior year level as expected
- Net financial liabilities remain at a low level
- Capital expenditure focuses on own retail and IT infrastructure
Principles and goals of financial management
Group-wide financial management is controlled centrally by the Group’s central Treasury department. The goals pursued include securing financial flexibility and stability, securing Group-wide liquidity and the management of financial risks. Group-wide financial management comprises Group financing, cash and liquidity management, the management of market price risks and the management of counterparty risks. Treasury principles which apply Group-wide govern all matters relevant to treasury, such as the approval of banking relationships, the handling of financing agreements, liquidity and asset management as well as the management of currency and interest rate risks.
Within Group financing factors such as market capacity, cost of financing, investor diversification, flexibility, covenants and terms to maturity are taken into account when selecting financial instruments. External loans for Group financing are taken out centrally and primarily in the Group’s reporting currency (euro) within the framework of an “inhouse bank” concept. To cover the financing needs of the Group companies, funds are made available in the form of intercompany loans. This allows economies of scale to be exploited and the cost of capital to be minimized. Occasionally, credit lines are also agreed with local banks in order to take account of legal, tax or other framework conditions. The Group’s financial liabilities are generally unsecured and may be subject to customary market obligations, which are reviewed on a quarterly basis.
The most important source of liquidity for the Group is the cash inflow from its operating activities. The Group’s central Treasury department optimizes and centralizes payment flows through its cash and liquidity management. Generally, Group companies transfer excess liquidity to the “inhouse bank”, e.g. as part of a cash-pooling procedure. In doing so, the excess liquidity of individual Group companies can be used to cover the financial needs of others. This intercompany financial offsetting system reduces the external financial requirement and thus brings down net interest expenses.
The management of market price risks is intended to limit the impact of interest and currency risks on cash flow. The use of hedging instruments, including forward foreign exchange transactions, currency swaps and interest swaps, is intended to secure the Group against unfavorable price developments. Risk Report, Material Financial Risks
The counterparty risk with regard to banks mainly results from the investment of liquid funds as part of cash and liquidity management and from the use of derivative financial instruments as part of interest rate and currency management. With regard to trading transactions, the Group aims for the broadest possible distribution of volumes and ensures that financial instruments are generally only contracted with counterparties that have very good credit ratings.
Capital structure and financing
HUGO BOSS is safeguarding its financial flexibility by means of a revolving syndicated loan of EUR 450 million until October 2022. The syndicated loan agreement contains a standard covenant requiring the maintenance of financial leverage, defined as the ratio of net financial liabilities to EBITDA before special items. At 0.0, the ratio continues to be substantially below the maximum permissible as of the reporting date (December 31, 2017: 0.0). The determination of financial leverage originally specified in the syndicated loan agreement and the level to be observed expressly excludes the impact of any changes in accounting standards on the indicator. Thus, it remains unaffected by the impact of IFRS 16, which is to be applied as of 2019, on EBITDA before special items. Notes to the Consolidated Financial Statements, Note 15
As of the reporting date, the Group’s debt continued to account for 47% of total assets (December 31, 2017: 47%). Current and non-current financial liabilities accounted for 20% or EUR 176 million of this (December 31, 2017: 16% or EUR 132 million). As of the reporting date, EUR 35 million of the syndicated loan had been drawn (December 31, 2017: EUR 16 million).
To ensure further liquidity, the Group has bilateral credit lines at its disposal with a total volume of EUR 217 million (December 31, 2017: EUR 210 million), of which EUR 134 million was claimed due to favorable interest rates by December 31, 2018 (December 31, 2017: EUR 106 million). The variable-interest financial liabilities amounting to EUR 138 million (December 31, 2017: EUR 100 million) included therein are largely subject to a short-term fixed interest rate. As of the reporting date, EUR 8 million of these liabilities were hedged against an increase in interest rates using interest rate swaps (December 31, 2017: EUR 9 million). Risk Report, Material Financial Risks Notes to the Consolidated Financial Statements, Note 20
In addition to the unused credit lines in the amount of EUR 498 million (December 31, 2017: EUR 538 million), the Group had at its disposal cash and cash equivalents in the amount of EUR 147 million (December 31, 2017: EUR 116 million). Financial Position, Statement of Cash Flows
Land charges in connection with land and buildings amount to EUR 27 million (2017: EUR 31 million).
Financing is supplemented by operating leases for the Group’s own retail stores and for logistics and administration properties. In subsequent periods, nominal minimum lease payments of EUR 1,369 million are due (2017: EUR 1,389 million). There are no other contingent liabilities. Notes to the Consolidated Financial Statements, Note 24
Statement of cash flows
The consolidated statement of cash flows is presented in accordance with IAS 7. The cash and cash equivalents reported herein correspond to the “cash and cash equivalents” item in the balance sheet. As cash flow is adjusted for currency effects, these figures cannot be derived from the consolidated statement of financial position.
|
2018 |
2017 |
||
Cash flow from operating activities |
322 |
420 |
||
Cash flow from investing activities |
(152) |
(126) |
||
Cash flow from financing activities |
(139) |
(254) |
||
Change in cash and cash equivalents |
31 |
32 |
||
Cash and cash equivalents at the beginning of the period |
116 |
83 |
||
Cash and cash equivalents at the end of the period |
147 |
116 |
In 2018, the free cash flow, measured as the sum of cash inflow from operating activities and cash outflow from investing activities was, at EUR 170 million, clearly below the prior year’s level (2017: EUR 294 million). This development is mainly due to a lower cash inflow from operating activities compared to the prior year.
At EUR 322 million, the cash inflow from operating activities was 23% below the prior year’s level (2017: EUR 420 million). This was mainly due to an increased cash outflow from changes in trade net working capital. In particular, higher inventories as compared to the prior year had a negative impact. As a result of a low amount of debt and low market interest rates, the net cash outflow from interest expenses and income was close to zero (2017: EUR 1 million).
Cash outflow from investing activities was EUR 152 million, 20% above the prior year (2017: EUR 126 million). This was mainly driven by higher capital expenditures on property, plant and equipment and intangible assets.
Cash outflow from financing activities was down sharply in fiscal year 2018, amounting to EUR 139 million (2017: EUR 254 million). This development reflects higher cash inflow from taking on current and non-current financial liabilities compared to the prior-year. At EUR 183 million, the dividend payment was slightly above the prior-year level (2017: EUR 179 million).
Net financial liabilities
Net financial liabilities are the total of all financial liabilities due to banks less cash and cash equivalents. Liabilities from finance and operating leases are not included in the calculation of this indicator. Net financial liabilities increased only marginally, to EUR 22 million, by the end of fiscal year 2018 (December 31, 2017: EUR 7 million). At EUR 169 million, financial liabilities due to banks were above the prior-year level (December 31, 2017: EUR 122 million).
Capital expenditure
In the past fiscal year, HUGO BOSS invested EUR 155 million in property, plant and equipment and intangible assets (2017: EUR 128 million). The investment volume was thus substantially higher than in the prior year. The main reason for this were investments in the modernization of the Group’s own retail network and its IT infrastructure.
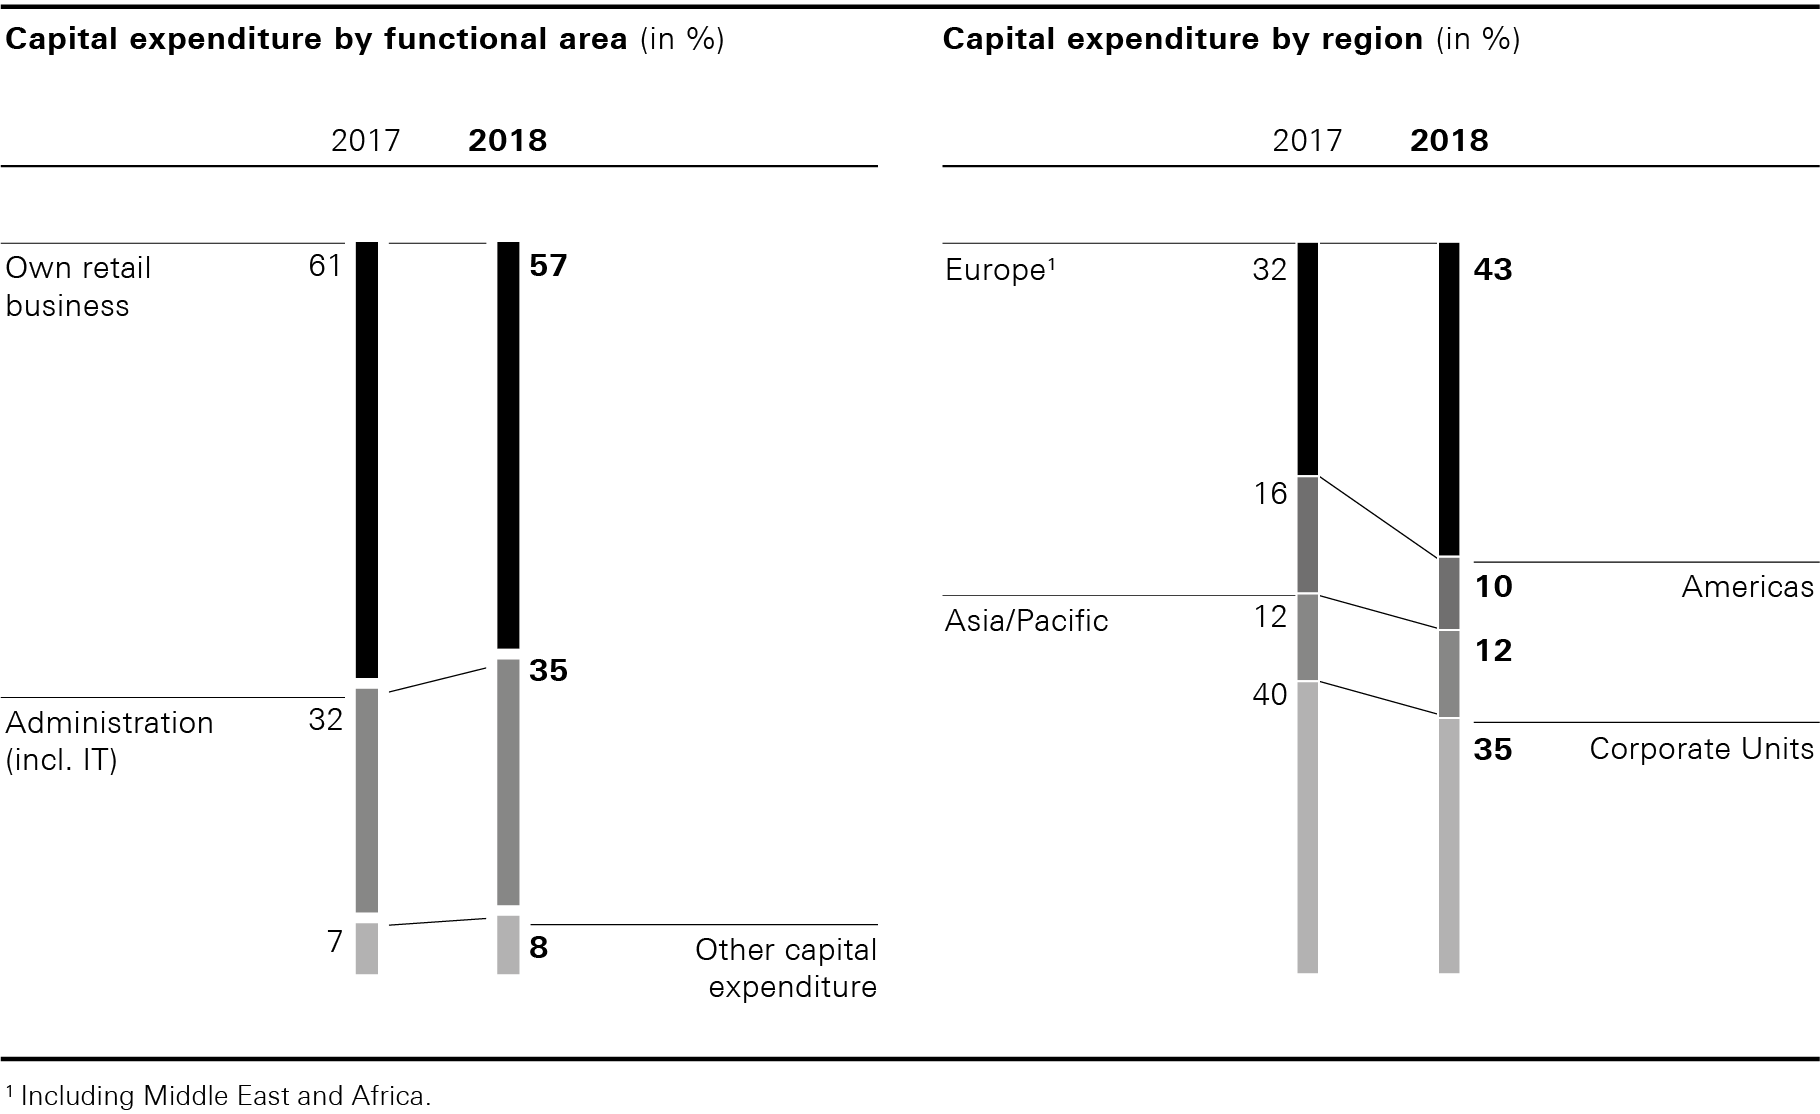
With an investment of EUR 89 million, the Group’s own retail network was once again the focus of investment activities (2017: EUR 77 million). Of this, EUR 45 million was spent on the renovation and modernization of own retail stores (2017: EUR 33 million), representing a 36% increase compared to the prior year. Focus in this regard was on the intensified conversion of existing BOSS stores to the new store concept. As in the prior year, EUR 44 million was invested in selective openings of own retail stores. (2017: EUR 44 million). A material amount of this was spent on investment on new construction of the outlet in Metzingen, which is scheduled to open at the end of 2019.
Capital expenditure on administration amounted to EUR 54 million in the past fiscal year (2017: EUR 41 million). This mainly includes investments of EUR 36 million in the IT infrastructure (2017: EUR 31 million). In addition to the continuous further development of the ERP system, there was further investment in 2018 specifically in connection with the cross-channel integration and the digitization of the Group’s own retail activities. The modernization of administrative facilities, which was also a part of the Group’s “New Ways of Working” project, contributed to the increase in capital expenditure on administration. Employees
Other capital expenditure on the production, logistics and distribution structure and on research and development in 2018 amounted to EUR 12 million (2017: EUR 10 million). This mainly includes replacement investments in the respective functional areas. The reason for the increase in 2018 was the renovation of a showroom in Switzerland.
The accumulated amortization and depreciation on property, plant and equipment and intangible assets including own capitalized cost came to EUR 963 million (2017: EUR 987 million). Existing obligations from investment projects totaled EUR 9 million as at December 31, 2018 (December 31, 2017: EUR 11 million). Notes to the Consolidated Financial Statements, Note 9