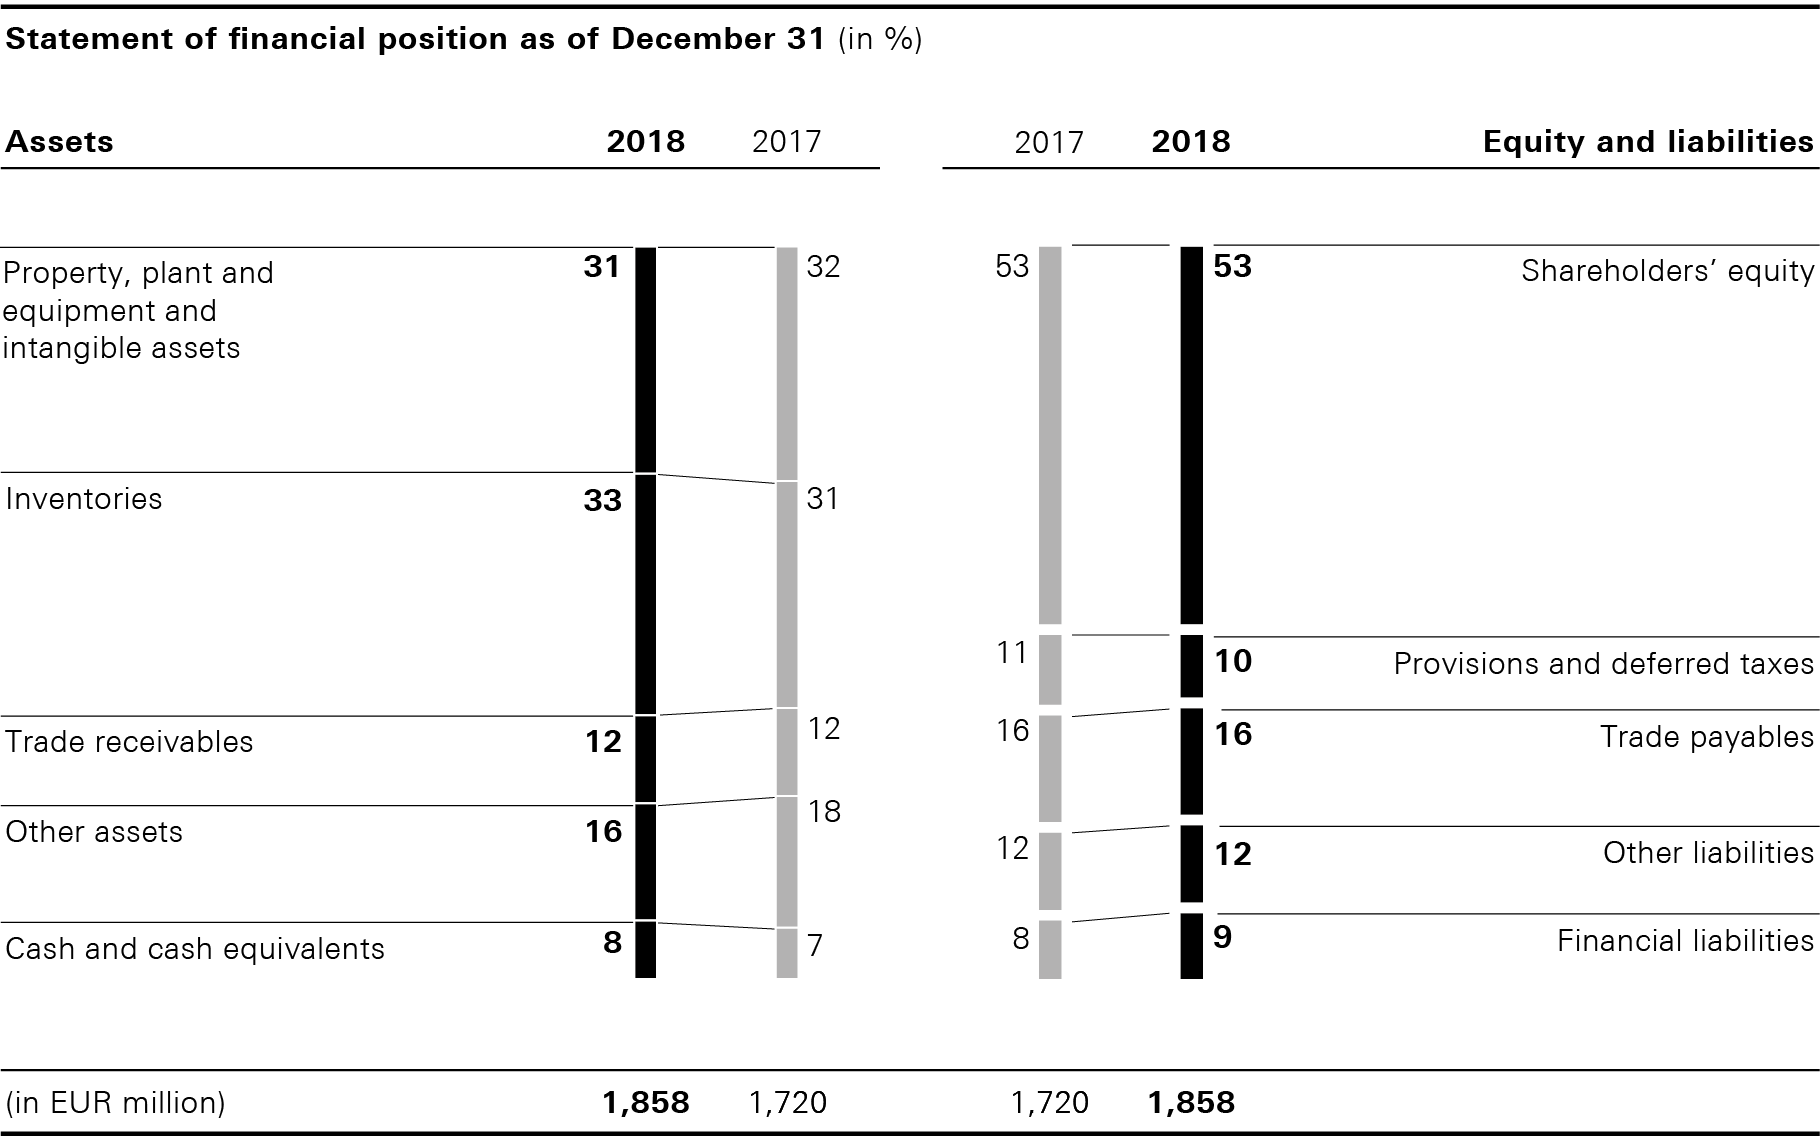
Net assets
- Equity ratio remains at 53%, unchanged to the prior year
- Higher capital expenditure results in a 5%-increase in property, plant and equipment and intangible assets
- Increase in inventories causes higher trade net working capital

Total assets rose by 8% compared to the prior year. This development is mainly due to higher inventories as well as an increase in property, plant and equipment and intangible assets. The latter increased this year, mainly due to capital expenditure being 5% higher than in the prior year. Financial Position, Capital Expenditure
At 63%, the share of current assets increased compared to the prior year (December 31, 2017: 61%). Accordingly, the share of non-current assets decreased to 37% as of December 31, 2018 (December 31, 2017: 39%). Unchanged compared with the prior year, the equity ratio was at 53% at the end of the year (December 31, 2017: 53%). Consolidated Financial Statements, Consolidated Statement of Financial Position
|
2018 |
2017 |
Change in % |
Currency-adjusted change in % |
||||
Inventories |
618 |
537 |
15 |
14 |
||||
Trade receivables |
214 |
208 |
3 |
3 |
||||
Trade payables |
295 |
286 |
3 |
2 |
||||
Trade net working capital |
537 |
459 |
17 |
16 |
The increase in inventories aims in particular at temporarily supporting sales momentum in the Group’s own retail business. Key for the development of trade receivables were higher sales in the wholesale channel. Trade payables also recorded a slight increase year-on-year as a result of delays in the receipt of invoices. Consequently, trade net working capital grew 17% in the Group´s reporting currency and 16% in local currencies, as compared to the prior year. At 19.7%, the moving average of trade net working capital as a percentage of sales based on the last four quarters was 110 basis points above the prior year’s level (2017: 18.6%).
Other assets remained at the prior year level. This item essentially comprises deferred tax assets, income tax receivables as well as other current and non-current assets. The slight decrease in the provisions and deferred tax liabilities item is derived essentially from lower provisions for goods returned. The increase in other liabilities is mainly due to slightly higher personnel and income tax liabilities over the prior year. Notes to the Consolidated Financial Statements, Note 17 and 21
The total of current and non-current financial liabilities increased by 34% to EUR 176 million as of the reporting date (December 31, 2017: EUR 132 million). This was driven by a lower cash inflow from operating activities. Financial Position, Capital Structure and Financing