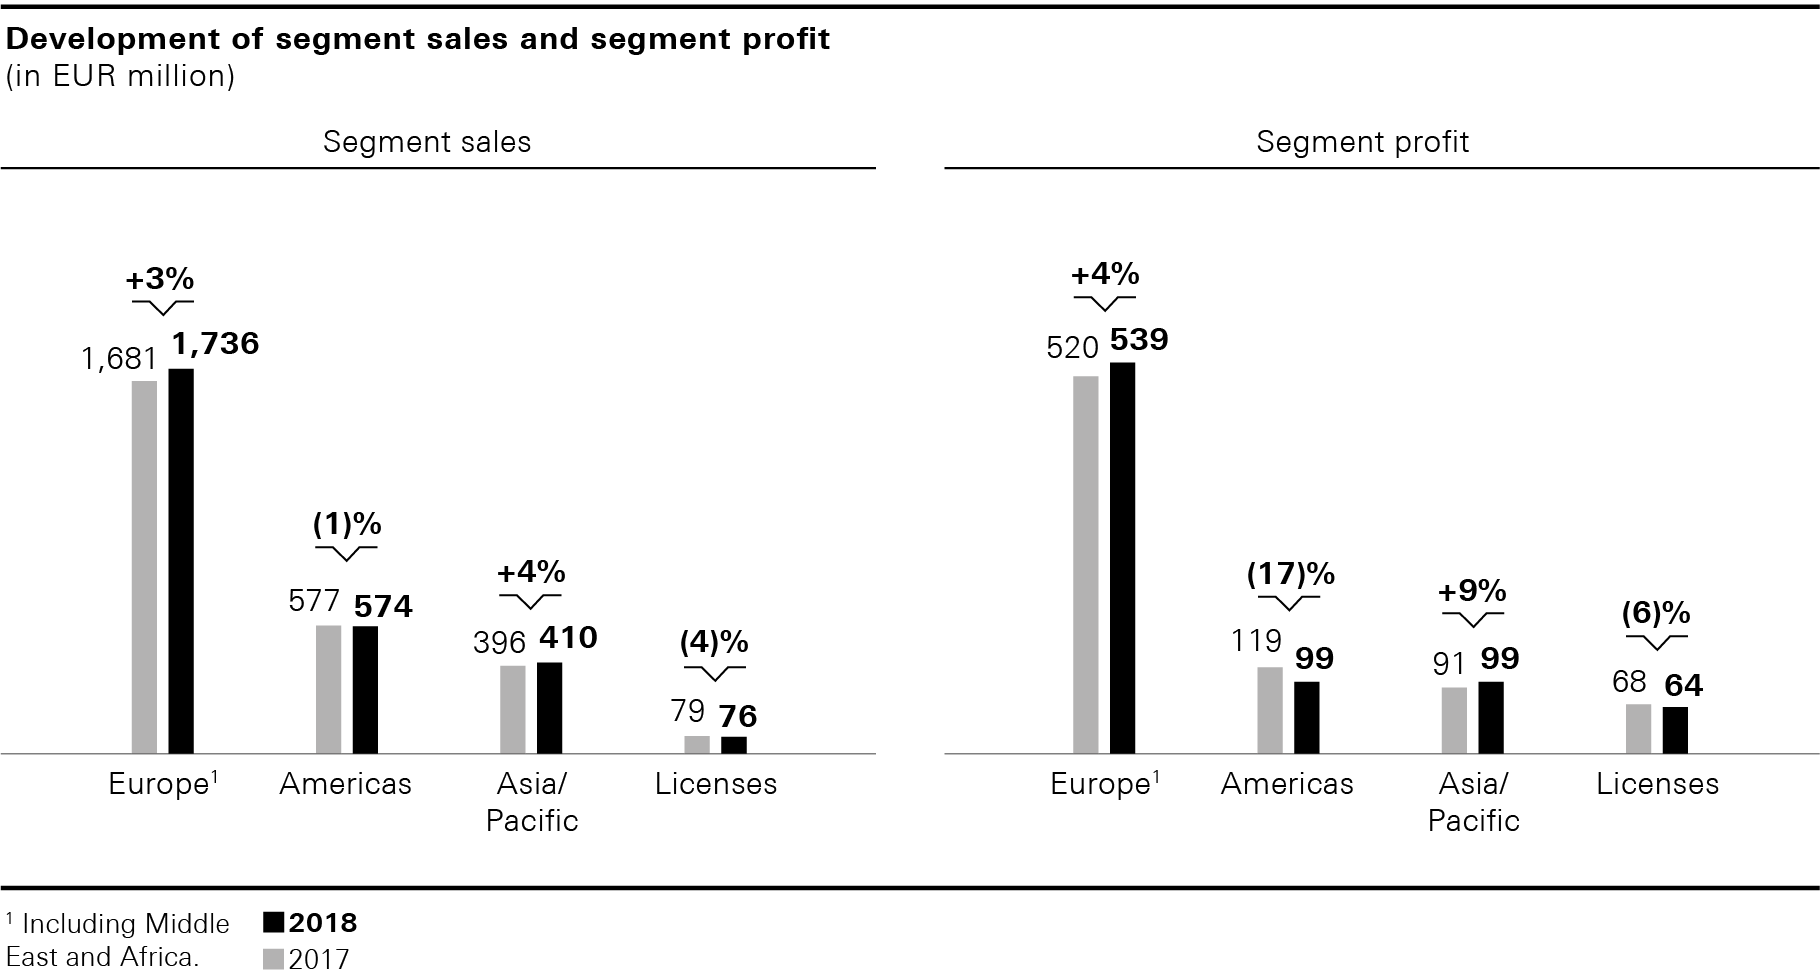
Sales and earnings development of the business segments

Europe
Currency-adjusted sales in Europe including the Middle East and Africa increased by 4% due to growth in both distribution channels. Sales in the Group’s own retail business increased by a mid-single-digit percentage rate, on a comp store and currency-adjusted basis.
|
2018 |
In % of sales |
2017 |
In % of sales |
Change in % |
Currency-adjusted change in % |
||||||
Group's own retail business |
1,004 |
58 |
975 |
58 |
3 |
4 |
||||||
Wholesale |
732 |
42 |
706 |
42 |
4 |
5 |
||||||
Total |
1,736 |
100 |
1,681 |
100 |
3 |
4 |
Against the background of a challenging market environment in Germany, both the Group’s own retail business and the wholesale business declined year on year. In total, sales, at EUR 429 million, were 4% below the prior year’s level (2017: EUR 448 million). Great Britain was once again the strongest single market in the region in fiscal year 2018, recording significant sales growth in both distribution channels. Sales in the Group’s reporting currency were up 11% to EUR 360 million (2017: EUR 325 million). In local currency, the market achieved a sales increase of 12%. In France, sales amounted to EUR 168 million, up 1% on the prior-year level (2017: EUR 165 million). Growth in the Group’s own retail business more than compensated for a decline in wholesale business in this market. In the Benelux countries, sales increased by 7% to EUR 143 million (2017: EUR 134 million), reflecting growth in both distribution channels.
At EUR 539 million, segment profit in Europe was up 4% over the prior year’s level (2017: EUR 520 million). The increase in sales was able to more than offset slightly higher operating expenses. At 31.1%, the adjusted EBITDA margin was therefore up 10 basis points on the prior year (2017: 30.9%). Notes to the Consolidated Financial Statements, Note 26
Americas
In the Americas, sales in local currencies rose by 4%. This was due to growth in both, the Group’s own retail business and wholesale business. On a comp store and currency-adjusted basis, sales in the Group’s own retail business increased by a mid-single-digit percentage rate.
|
2018 |
In % of sales |
2017 |
In % of sales |
Change in % |
Currency-adjusted change in % |
||||||
Group's own retail business |
389 |
68 |
392 |
68 |
(1) |
4 |
||||||
Wholesale |
185 |
32 |
185 |
32 |
0 |
4 |
||||||
Total |
574 |
100 |
577 |
100 |
(1) |
4 |
In the United States, sales in the reporting currency slightly declined and totaled EUR 422 million (2017: EUR 423 million). By contrast, sales in the local currency rose by 4% as a result of growth in both distribution channels. In Canada, sales declined by 3% in the reporting currency to EUR 82 million (2017: EUR 84 million). Supported by a positive sales development in the Group’s own retail business, currency-adjusted sales grew 1%. In Latin America, sales remained at the prior year’s level at EUR 70 million (2017: EUR 70 million). This represents a 9% sales increase in local currencies. Both distribution channels supported this development, with the Group’s own retail business in particular showing strong growth.
At EUR 99 million, the segment profit of the Americas region was 17% below the prior year’s level (2017: EUR 119 million). This was primarily due to the decline in gross profit, mainly as a result of negative currency effects, which more than offset the positive effect of lower operating expenses. At 17.2%, the adjusted EBITDA margin for this region was 340 basis points below the prior year’s level (2017: 20.6%).
Asia/Pacific
Currency-adjusted sales in Asia/Pacific rose by 7% in the past fiscal year. Currency-adjusted sales in the Group’s own retail business grew at a high single-digit percentage rate both in total and on a comp store and currency-adjusted basis.
|
2018 |
In % of sales |
2017 |
In % of sales |
Change in % |
Currency-adjusted change in % |
||||||
Group's own retail business |
376 |
92 |
365 |
92 |
3 |
7 |
||||||
Wholesale |
34 |
8 |
31 |
8 |
11 |
15 |
||||||
Total |
410 |
100 |
396 |
100 |
4 |
7 |
At EUR 228 million, sales in China were 3% up on the prior year’s level (2017: EUR 221 million). This represents a currency-adjusted sales increase of 7%. With double-digit growth rates on a comp store basis, the Group’s own retail business developed extremely positively both on the Chinese Mainland and in Hong Kong and Macau. In Oceania, sales in the Group’s reporting currency declined by 8% to EUR 56 million (2017: EUR 61 million). This represents a currency-adjusted sales decrease of 2%. At EUR 52 million, sales in Japan grew 7% over the prior year (2017: EUR 49 million). In local currency, Japan recorded an increase in sales of 10%.
At EUR 99 million, the segment profit of Asia/Pacific was 9% up on the prior year’s level (2017: EUR 91 million). In addition to the positive sales development, a decline in operating expenses also contributed to this development. At 24.2%, the adjusted EBITDA margin in this region was up 120 basis points on the prior year (2017: 23.0%).
Licenses
Sales in the license business declined by 4% to EUR 76 million (2017: EUR 79 million) in fiscal year 2018. Earnings Development, Sales by Distribution Channel
As a result, the segment profit was 6% below the prior year’s level, totaling EUR 64 million (2017: EUR 68 million).