Sales performance
In fiscal year 2018, HUGO BOSS generated Group sales of EUR 2,796 million, up 2% in the Group’s reporting currency compared to the prior year (2017: EUR 2,733 million). Currency effects had a negative impact on Group sales in the reporting period, following the appreciation of the euro against most other currencies. Consequently, in local currencies, HUGO BOSS recorded a 4% increase in sales compared to the prior year.
Sales by region
|
2018 |
In % of sales |
2017 |
In % of sales |
Change in % |
Currency-adjusted change in % |
||||||||
|
||||||||||||||
Europe1 |
1,736 |
62 |
1,681 |
62 |
3 |
4 |
||||||||
Americas |
574 |
20 |
577 |
21 |
(1) |
4 |
||||||||
Asia/Pacific |
410 |
15 |
396 |
14 |
4 |
7 |
||||||||
Licenses |
76 |
3 |
79 |
3 |
(4) |
(4) |
||||||||
Total |
2,796 |
100 |
2,733 |
100 |
2 |
4 |
||||||||
All three regions recorded currency-adjusted sales increases in fiscal year 2018. Europe, including the Middle East and Africa, benefited in particular from double-digit growth in Great Britain. In the Americas, in addition to a mid-single-digit growth in the United States, the other markets also contributed to the sales increase. In Asia/Pacific, China continued to be the growth engine with high single-digit growth rates. Earnings Development, Sales and Earnings Development of the Business Segments
Sales by distribution channel
|
2018 |
In % of sales |
2017 |
In % of sales |
Change in % |
Currency-adjusted change in % |
||||||||
|
||||||||||||||
Group's own retail business |
1,768 |
63 |
1,732 |
63 |
2 |
41 |
||||||||
Directly operated stores |
1,096 |
39 |
1,103 |
40 |
(1) |
2 |
||||||||
Outlet |
562 |
20 |
550 |
20 |
2 |
4 |
||||||||
Online |
110 |
4 |
79 |
3 |
39 |
41 |
||||||||
Wholesale |
952 |
34 |
922 |
34 |
3 |
5 |
||||||||
Licenses |
76 |
3 |
79 |
3 |
(4) |
(4) |
||||||||
Total |
2,796 |
100 |
2,733 |
100 |
2 |
4 |
||||||||
Currency-adjusted sales in the Group’s own retail business grew by 4% in fiscal year 2018, supported by increases in all sales formats. In particular, the online business achieved significant double-digit growth and increased by 41% compared to the prior year. At the end of fiscal year 2018, the online sales of HUGO BOSS for the first time exceeded the EUR 100 million mark. Overall, at 63%, the share of the own retail business in Group sales remained stable in fiscal year 2018. On the basis of retail comp store sales, i.e. including retail spaces opened or taken over before December 31, 2016, sales in the own retail business rose by 2% year on year in the reporting currency. In currency-adjusted terms, this represents an increase of 5%.
Sales in the wholesale channel also developed positively. This was due both to high single-digit growth in the replenishment business, with which HUGO BOSS responds to short-term demand from wholesale partners, as well as delivery shifts compared with the prior year. At 34%, the share of the wholesale business in Group sales remained stable in fiscal year 2018.
Sales in the license business declined slightly in fiscal year 2018. Higher license income from watches and eyewear only partially offset declining license income from fragrances. At 3%, the share of license business in Group sales remained stable compared to the prior year.
Sales by brand
|
2018 |
In % of sales |
2017 |
In % of sales |
Change in % |
Currency-adjusted change in % |
||||||
BOSS |
2,422 |
87 |
2,336 |
85 |
4 |
6 |
||||||
HUGO |
374 |
13 |
397 |
15 |
(6) |
(4) |
||||||
Total |
2,796 |
100 |
2,733 |
100 |
2 |
4 |
The sales development of BOSS and HUGO was impacted by ongoing changes in the distribution strategy in fiscal year 2018. The Group had decided to transfer selling space from HUGO to BOSS both for certain product categories in the wholesale channel and in selected own retail stores. Besides that, the Group reduced the presence of HUGO in the outlet channel. These measures were intended to sharpen the brand positioning of HUGO. Group Strategy, HUGO Brand Strategy
As a result, sales of the HUGO brand declined, as expected, in fiscal year 2018. Double-digit growth in casualwear could only partially compensate for declines in businesswear. The BOSS brand, on the other hand, recorded significant increases in sales, driven by high single-digit growth in businesswear and casualwear.
Sales by gender
|
2018 |
In % of sales |
2017 |
In % of sales |
Change in % |
Currency-adjusted change in % |
||||||
Menswear |
2,517 |
90 |
2,440 |
89 |
3 |
5 |
||||||
Womenswear |
279 |
10 |
293 |
11 |
(5) |
(3) |
||||||
Total |
2,796 |
100 |
2,733 |
100 |
2 |
4 |
Menswear benefited from double-digit growth in casualwear and mid-single-digit growth in businesswear. The decline in sales of womenswear is attributable to the reduction of retail space of the BOSS brand in freestanding stores. This could not be offset by growth in the HUGO brand. Group Strategy
Network of own retail stores

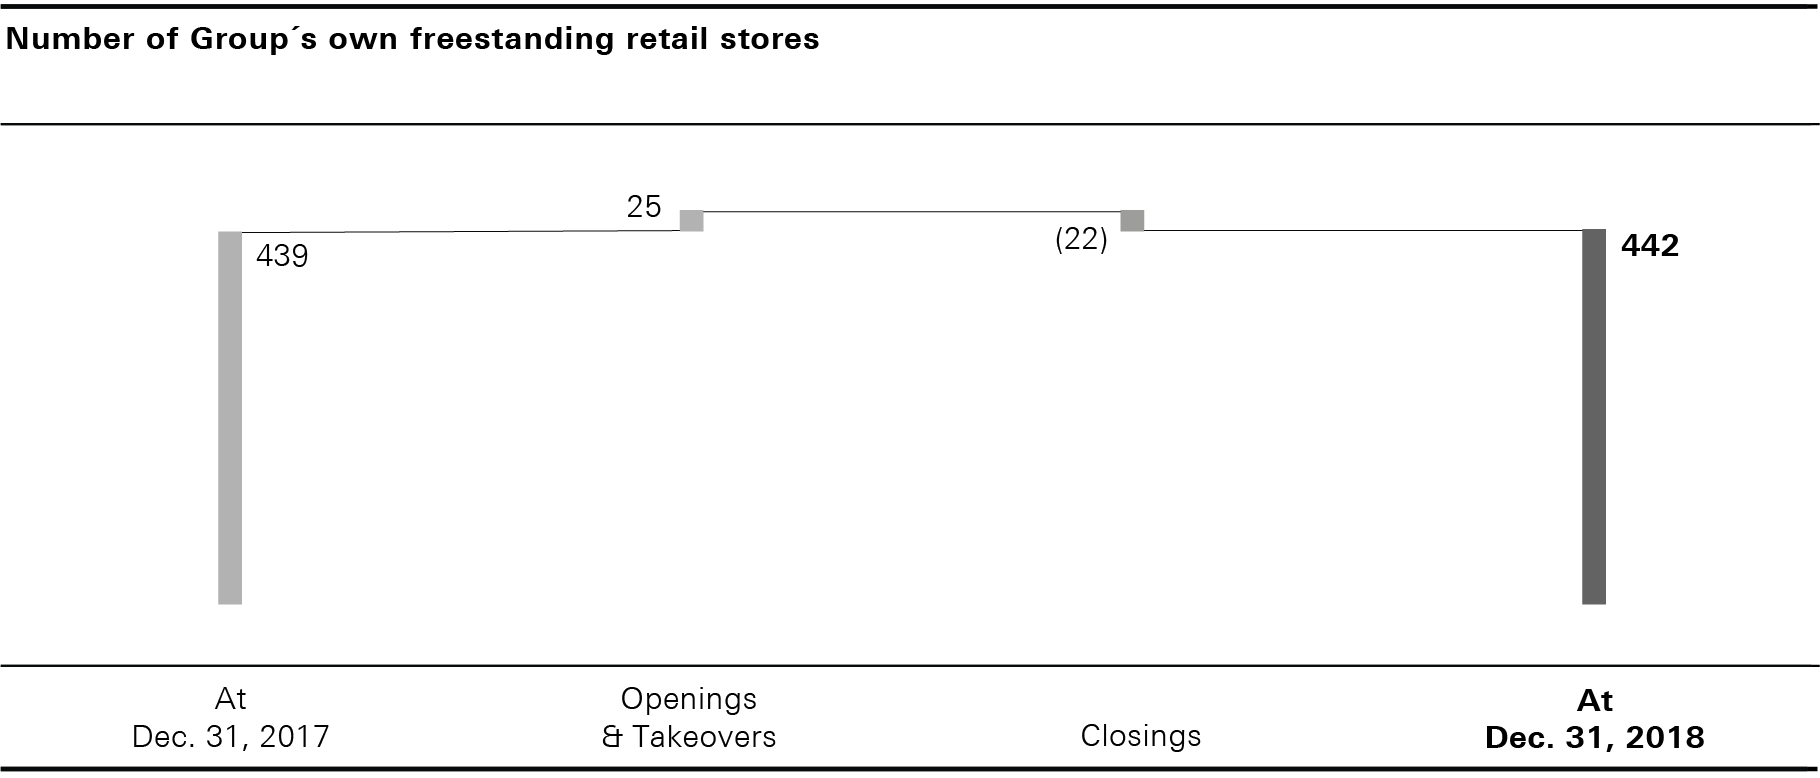
In fiscal year 2018, the number of own freestanding retail stores increased by a net figure of three to 442 (2017: 439). 13 newly opened BOSS stores, mainly in Europe and Mainland China, were offset by 22 store closures with expiring leases. This included the relocation of two sites within the same metropolitan area. In addition, twelve HUGO stores with their own store concept were opened in fiscal year 2018 in selected metropolises, including London and Paris.
2018 |
Freestanding stores |
Shop-in-shops |
Outlets |
Total |
||||
Europe |
199 |
317 |
69 |
585 |
||||
Americas |
89 |
92 |
50 |
231 |
||||
Asia/Pacific |
154 |
91 |
52 |
297 |
||||
Total |
442 |
500 |
171 |
1,113 |
||||
|
|
|
|
|
||||
2017 |
|
|
|
|
||||
Europe |
192 |
351 |
65 |
608 |
||||
Americas |
90 |
99 |
50 |
239 |
||||
Asia/Pacific |
157 |
88 |
47 |
292 |
||||
Total |
439 |
538 |
162 |
1,139 |
Including shop-in-shops and outlets, the total number of retail stores operated by HUGO BOSS worldwide were reduced as at December 31, 2018, by a net figure of 26 to 1,113 (2017: 1,139). The decline was mainly due to the conversion of small shop-in-shops from the retail model to the wholesale model in Europe.

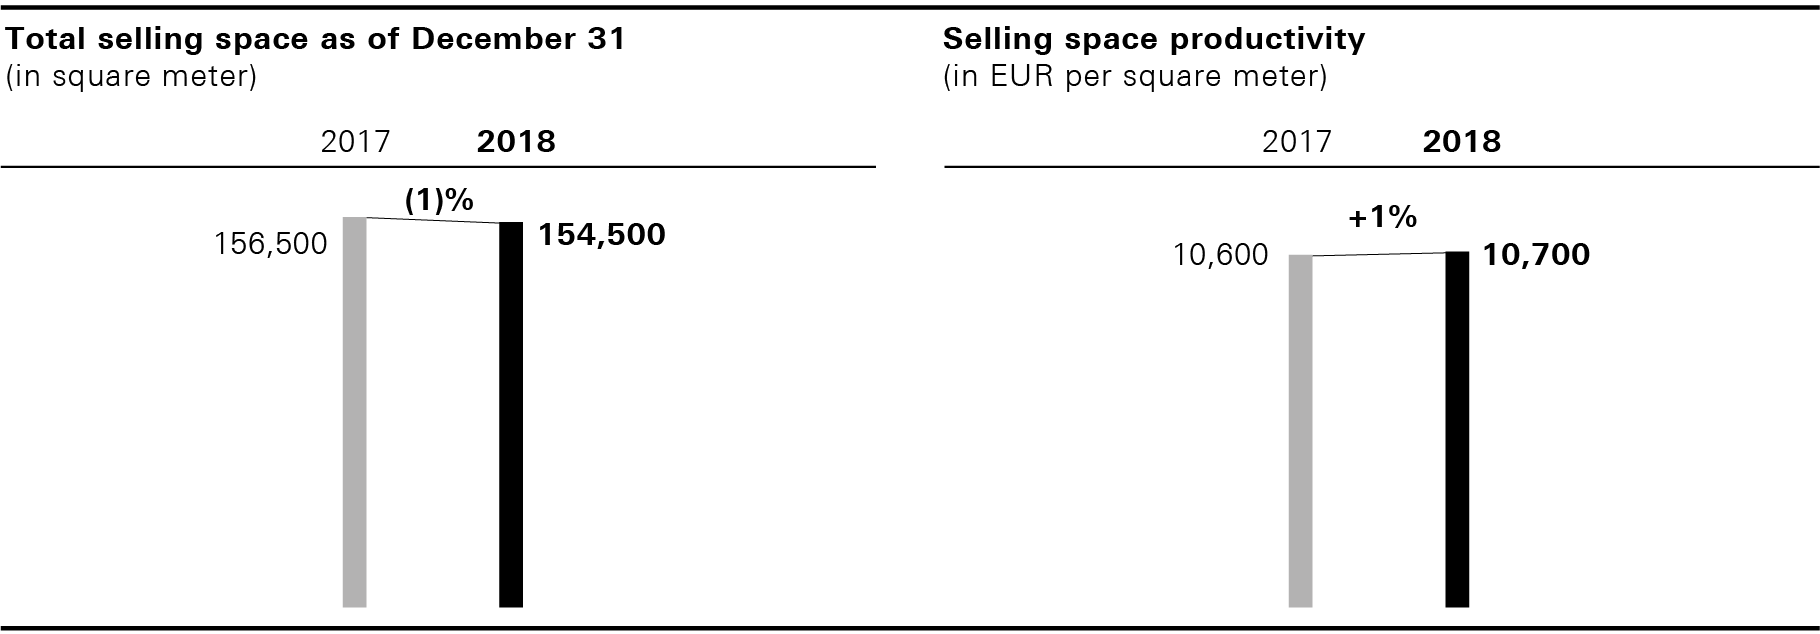
The total selling space of the Group’s own retail business decreased by 1% and amounted to around 154,500 sqm at the end of the year (December 31, 2017: 156,500 sqm). Selling space productivity in the brick-and-mortar retail business increased by 1% to around EUR 10,700 per sqm in fiscal year 2018 (2017: EUR 10,600 per sqm).